The 35th annual Cost vs. Value report by Zonda (JLC’s parent company) shows improvement projects that are on the exterior of the house continuing a multiyear trend of providing the greatest return on investment (ROI) to homeowners. Of the 22 remodeling projects in the report, 11 are exterior replacement projects, and all of these rank within the top 12 projects with the highest ROI. At the top is the replacement of the garage door (at No. 1; see “Cost vs. Value: National Averages,” right), new siding (including manufactured stone veneer as an exterior accent at No. 2 and fiber cement at No. 4), and windows (with vinyl replacement windows at No. 5 and wood replacement windows at No. 7). The one exception to the exteriors trend, sitting at No. 3, is the minor kitchen remodel—a modest kitchen face-lift that offers a relatively high return when done prior to the sale of a house. The reason this ranks high stems from the nature of the Cost vs. Value report.
The Cost vs. Value report aims to answer a specific question: What value does a particular remodeling project add to the sale price of a home? This is only one kind of value that these projects can provide, but it proves to be an important assessment.

What Sort of Value?
The value data in the report was derived in prior years from surveys of real estate professionals who were asked to rate the value of the 22 projects in their area. In the past two years, Zonda has revamped the report’s methodology, providing an econometric model that overcomes a past difficulty of surveying a sufficient number of real estate professionals in some areas. The new model sifts in a range of other relevant variables, including local GDP, existing home sales, existing home values, changes in existing home sales, existing home values, and housing starts, among others. What’s important to grasp here is that all of these variables (yes, even new housing starts) influence the sale price of existing homes in specific markets, and that is what defines the value side of the calculated ROI.
There is more than one kind of value. Lifestyle enhancement or increased accessibility or the ability to accommodate a growing family are all reasons homeowners take on remodeling projects, each with its own type of value. Cost vs. Value focuses on another sort—the value that leads to a higher sale price for an existing home. If we begin to think a bit more like a real estate professional, we begin to grasp how to fully understand this value and, correspondingly, the return on investment.
Local markets. “Location, location, location” we all know as the first principle of real estate, and the Cost vs. Value report addresses this by providing data for 150 metro markets and allowing users to drill down to data at the ZIP code level to obtain a more fine-grained view of how costs and values differ among metro areas.
Exterior condition. “Curb appeal” and “first impressions” are strong concepts in real estate because they have a surprisingly big impact on how much money prospective home buyers are willing to pay for a home. Prospective buyers who see a “buttoned up” exterior form the impression that the house is in good shape—or, as we all like to say, “has good bones”—and they proceed to fit all the new information they learn once they walk through the front door around these positive impressions. The reverse case—that is, driving up and seeing a dilapidated garage door or a house in need of a paint job—has the reverse effect: Buyers immediately start to downgrade what they are willing to pay for the house. While these impressions are highly subjective, they tend to influence buyers in a remarkably consistent ways. And this tendency goes a long way toward explaining the high ROI on exterior replacement projects.
Discretionary projects. While still returning a strong return on investment, larger discretionary projects, such as kitchen, bath, and master-suite remodels and additions, tend to have a lower impact on the price of a home. These projects typically involve a large number of products that have strong appeal to the client making the selections but that also tend to be quite individualized without garnering broad appeal. There is no one best cabinet style or color, perfect tile, or fixture design that everyone likes. Certainly, there are design trends that have wide appeal among a range of homeowners. But because of the vast differences in aesthetic tastes, real estate brokers know that one person’s elegant new kitchen or bath may be viewed by other prospective buyers as unappealing, overstated, or otherwise in need of a reset.
The minor kitchen remodel ranks high, I believe, because most prospective buyers who are trying on a new home ask: “Can I live with this kitchen until we build back our savings and we can create our dream kitchen?” If the answer is yes, they are much more likely to meet the seller’s price, or even bid higher.
Heavy Costs
The strong leaning toward exterior replacement projects having the highest return on investment predates the pandemic. It’s important to understand that the Cost vs. Value data doesn’t track the most popular projects; this is not a design trends report. Costs are based on common projects that are assigned specific dimensions and details in order for the cost information to have teeth in the real world of contracting.
The Cost vs. Value report tracks the ratio of value over cost for 22 common remodeling projects, and in that ratio lies the rub: Across the board, material costs have been increasing for the last decade, and increasing sharply for the past two years. And even while values have also been steadily inching up for the past five years, the high numbers on the bottom of the ratio (cost) bring down the overall number, which is the return on investment.
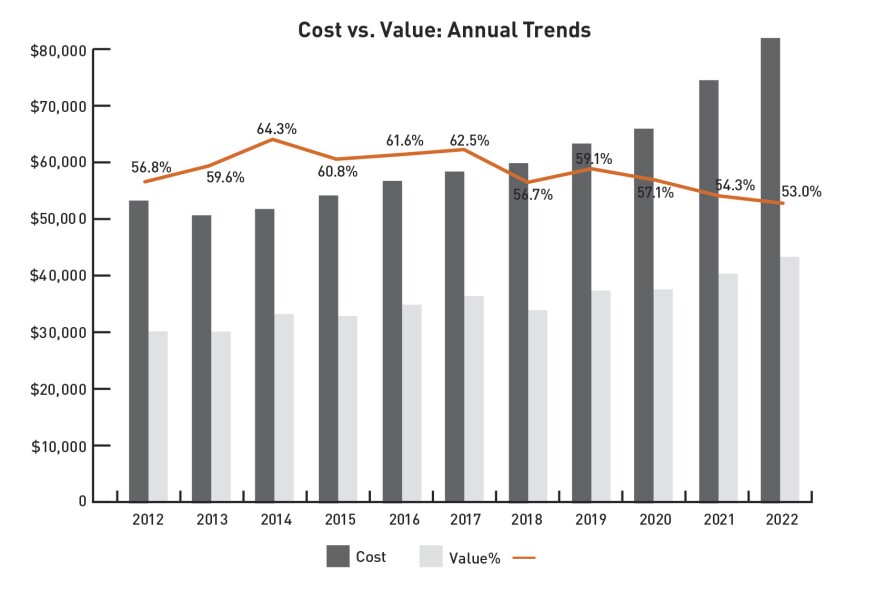
A look at yearly trends (see “Cost vs. Value: Annual Trends,” opposite page) shows that project costs have risen consistently since 2014, with a sharp increases in costs in the last two year brought on by supply-chain disruptions largely created by the pandemic. Mirroring the increase in costs, the value-over-cost ratio as a percentage declined over the same two year period. (Please note the Cost vs. Value report reflects economic changes that occurred the previous year, so this drop reflects activity in 202 and 2021.) It’s worth noting that despite the sharp cost increases for building materials in 2021, the decline in overall ROI in the 2022 report was a modest 1.3%, confirming the resiliency of robust remodeling markets amid economic concerns and supply-chain challenges.

Regional Trends
Of the nine regions, three—Pacific, New England, and Middle Atlantic—outperformed the national average of 61.7% (for all 22 projects), with the Pacific region leading at nearly 8% above the national average. New England was 1.4% higher, and the Middle Atlantic, almost 1% higher. The West North Central region fell below the national average by 5.2%; the West South Central region was under by 2.9%. All other regions were within 2% below the national average.